Our Technology
MetaTech uses artificial intelligence techniques to match patterns in price history with current prices, to generate buy-sell signals.
Pattern matching technology is well established and is used in many areas in which we are all familiar, such as OCR (Optical Character Recognition) and facial recognition. MetaTech uses a proprietary implementation of this technology to analyze patterns in open-high-low-close prices over a time period, usually days. The current pattern is compared to many historical patterns for similarity. When matches are found, the price changes that have occurred after those matches can be algorithmically processed to generate a buy or sell signal. The signal is combined with data from existing positions to trigger an order.
MetaTech currently is being used to trade stocks (including OTC) and futures, using an approach known as “swing trading”. Positions have a duration of 2 to 10 days typically.
Thousands of man-hours have gone into the development of the MetaTech system. MetaTech runs in the cloud and connects in real-time via API with independent brokerage accounts on behalf of multiple traders.
How does it work?
Consider these three “candlestick” charts of 15 consecutive days of price history for a particular symbol. Chart A represents the most recent 15 days.
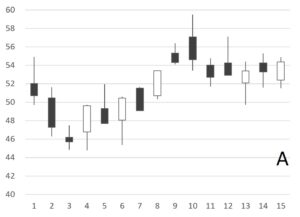
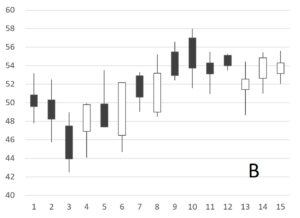
Chart B represents another 15-day period taken earlier in the last 12 months. The Chart C represents yet another 15-day period in the same 12 months.
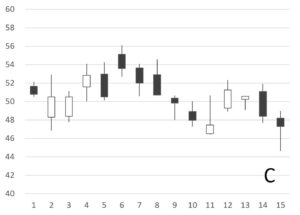
Notice A and B are similar, but not the same. A and C are different. The MetaTech pattern matching system would quantify the similarity and develop a score for each comparison. A‒B is a high score while A‒C is a low score.
Of all the possible comparisons in the last 12 months, some would be high-scoring while most would be low-scoring. The high-scoring set would be grouped and analyzed further. Let’s say that a few days after each of the high-scoring set, the price moved up by an average of 5 points. That would trigger a buy signal for the current day.
This explanation is rather simplistic and leaves out a lot of details, many of which are proprietary. For example, what is the matching algorithm? What are the criteria for high vs low score? How big does the average move have to be (5 in the example) to trigger a signal? How much data is needed to make a valid assessment? What is the ideal time period (15 in the example)? How far back should you look at data (12 months in the example)?
The answers to these questions are developed with extensive computational testing and simulation.