Technical Analysis
Securities analysis broadly is divided into two approaches, either fundamental or technical.
Fundamental analysts study a company, its management, its products, competitors, and economic trends. Based on their study, they come to a point of view as to whether the stock is overpriced or underpriced, and they use this evaluation to buy or sell a stock. Futures are studied based on their characteristics and traded similarly.
Technical traders disregard these “fundamentals”. They embrace the notion, which comes from the efficient market theory of economics, that such information is reflected very quickly in securities prices. Instead, technical traders look at price activity for trends generated by traders. These trends show up as patterns on price charts that are defined by mathematics or geometry. Some popular examples:
- Flags, pennants, head & shoulders, and other geometrics
- Trendlines, channels, support, resistance, gaps
- Bollinger Bands, Fibonacci ratios, moving averages, relative strength index
Fundamental analysts see technical analysis as unscientific. They view price movements over time, after taking fundamentals into account, as largely random.
While we respect both fundamental and technical analysis, essentially we disregard both, except to the extent that patterns they generate are detected using artificial intelligence techniques. So, while MetaTech does not take a position on the fundamental vs. technical analysis question, paradoxically they both contribute to our success.
MetaTech transcends all the discretely defined patterns, such as those noted above. By matching historic patterns with current patterns, MetaTech essentially accomplishes what all traditional technical analyses might do together. So whether those technical trades work or don’t work is not important. What is important is that many technical traders are vigorously participating in the markets, leaving their own imprints on price history. MetaTech is uniquely set up to identify and capitalize on all that activity.
Of course, fundamental forces can overwhelm technical forces on some days, and MetaTech positions can be significantly affected by these news stories and world events. That is one reason why we don’t achieve profitability on all trades.
MetaTech vs traditional technical trading
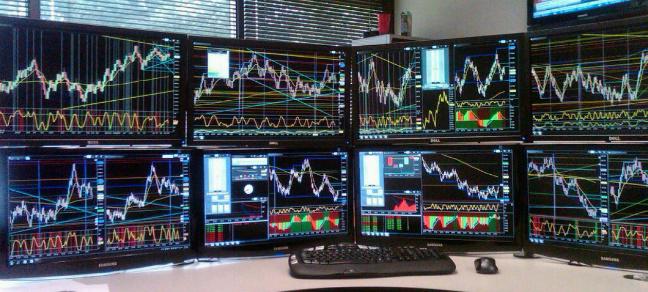
Consider this photo of a typical trading desk. Despite the appearance of a lot of technology, this approach of visually scanning charts is primitive. Following charts and looking for patterns is an old technique, and it is labor-intensive.
Some technical traders have automated their techniques to an extent. But MetaTech goes far beyond those arrangements. That is because every technical system is some finite combination of the traditional techniques. Which ones are valid out of the hundreds available? It’s hard to say. MetaTech transcends this issue because it uses pattern matching techniques which are sensitive to any and all technical methods.
The hierarchy of technical trading
MetaTech occupies a unique middle tier in the hierarchy of technical traders.
The top level is comprised of big trading houses such as Virtu and Citadel. Their staffs encompass thousands of programmers and analysts. An outsider cannot gain access to, or make sense of, what goes on inside these firms.
The lowest level is all the individuals and firms who study charts and use some combination of the well-known technical approaches. Mostly, they enter orders on a keyboard. We label these as primitives.
The tier in the middle is MetaTech, which we label the sweet spot. Our technology is sophisticated, while at the same time it is easy to use and manage.